
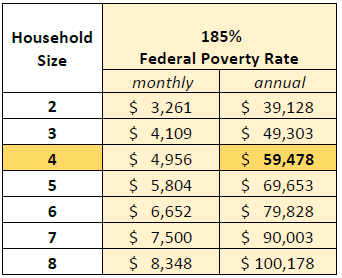
Currently, a Nebraska family of four with two working parents qualifies for childcare subsidies until their combined earnings reach $59,478 per year. If both parents are working full-time, that means they would each need to make no more than $14.30 per hour. Anything over that, they would lose their childcare subsidies.
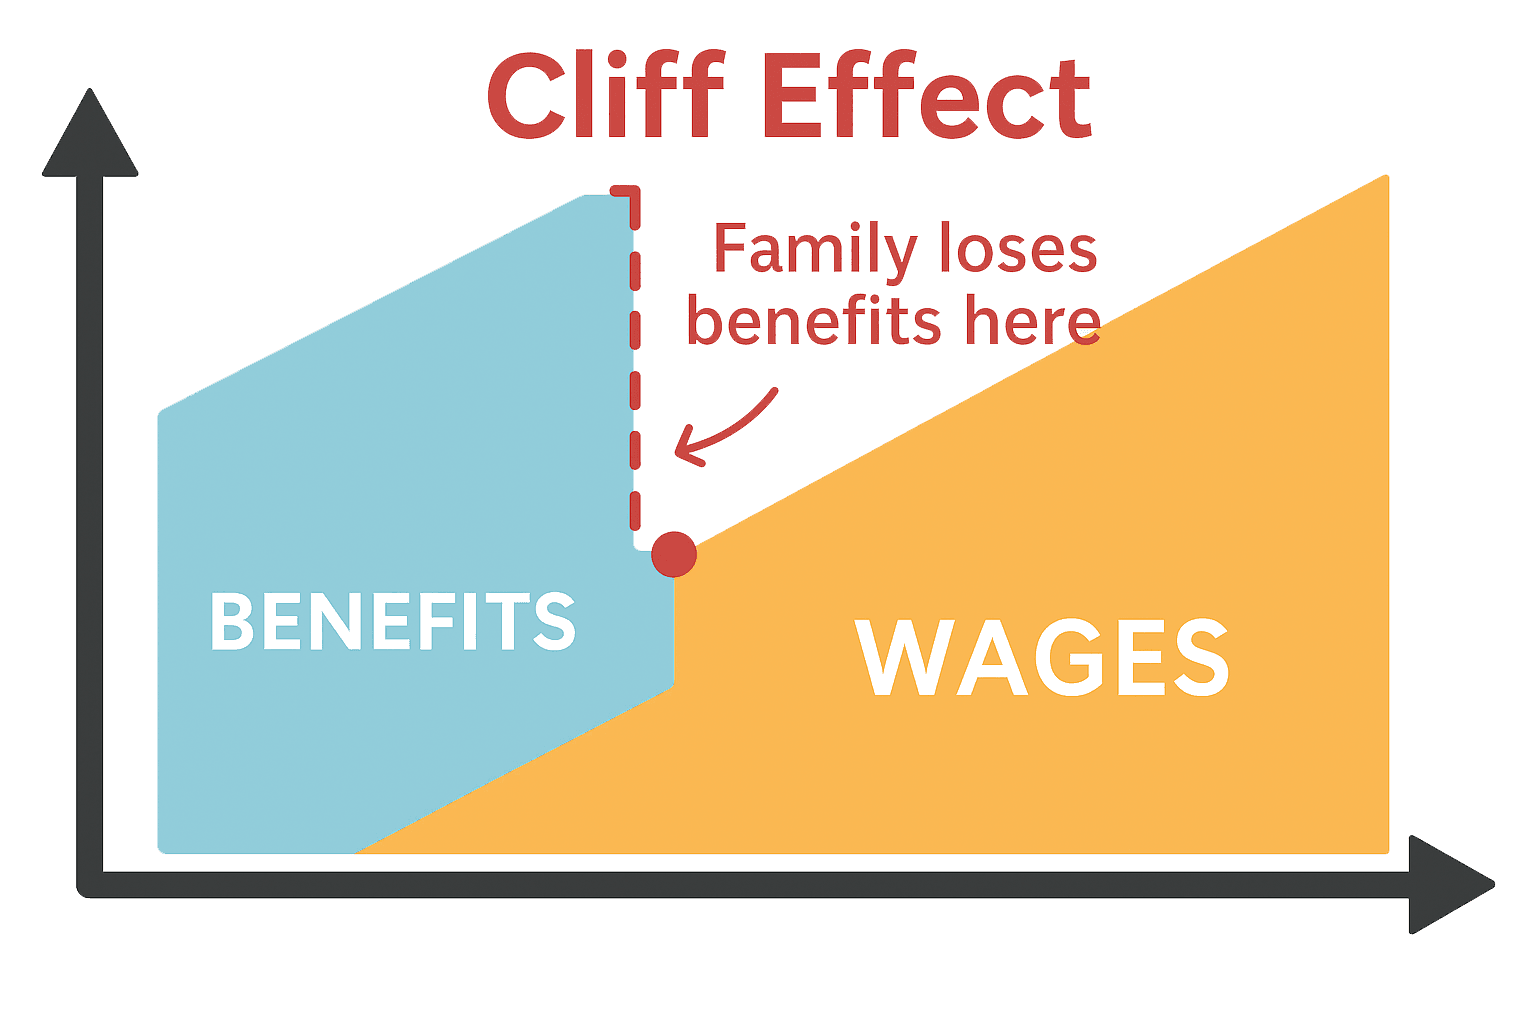
This leaves a gap where achieving self-sufficiency becomes increasingly difficult as Nebraska is one of the few remaining states without a graduated system to lessen family's reliance on financial assistance. This is known as the Cliff Effect because even a slight change in income can disqualify their eligibility subsidies and push them off the "cliff" of self-sustainability.
Many of our parents often work multiple jobs while trying to complete their own education and are sometimes put in a situation of having to choose between basic needs and stable childcare solutions.
Cost of Care: If this same family has a 12-month old and an 8-year old, they would need full-time infant care, an afterschool program and summer program, the average cost could be more than $20,000 per year. Without subsidies, their childcare costs would make up over one-third of their gross income.
At Kids Can, we offer reduced program fees for families who do not qualify for Nebraska’s childcare subsidies. Often one of the biggest challenges for our families is access to consistent high-quality childcare and programs for those families who do not qualify for Nebraska's subsidies. We want to attract families who typically would not have access or be able to consider a consistent, high level of care for their child(ren).
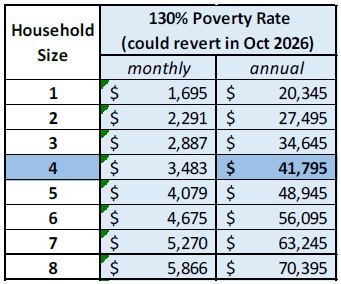
What's Next For Nebraska Families: If LB304 does not pass, in October 2026, that same family would need to make an income of less than $41,795 (130% of the federal poverty rate) to be eligible for childcare subsidies.
For this family to break even on their budget, they would need to increase their household income by 35% in one year.
Why This Affects Our Families
The majority of our families have an annual household income of less than $60,000. Below are demographic statistics from FY25 (July 1, 2024 - June 30, 2025).
| Annual Household Income | Percentage |
|---|---|
| Under $30,000 | 52% |
| $30,000 - $59,999 | 34% |
| $60,000 and over | 14% |